Description
This section gives extremely useful insights about audience growth, activities, demographics and when they're most active on Instagram. This helps in developing the rights strategies to meet growth targets. It also helps in optimizing content, posting time and posting frequency.
This section contains the following sub-sections
- Audience Growth (FREE)
- Audience Activities *
- Audience Gender and Age *
- Audience Demographics *
- Online Followers *
NOTE: This section requires Premium Subscription and are only available for Instagram business accounts with Facebook login. Learn more here.
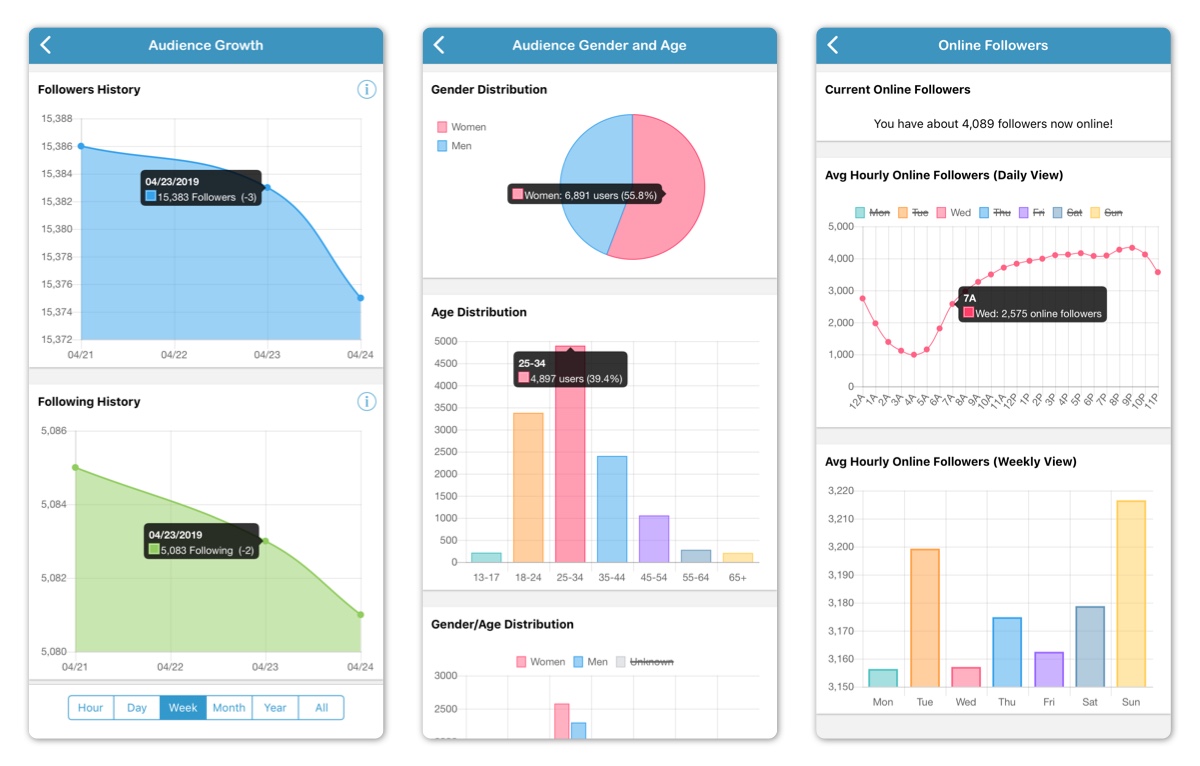
1. Audience Growth
This sub-section gives insights about how audience evolve over time, and that helps in determining how growth targets are being met and if some change in strategy is needed.
This sub-section includes the following charts:
- Followers History
- Following History
The following time periods are available for history charts:
- All Time (Default)
- Year
- Month
- Week
- Day
- Hour
Tapping on a chart reveals the value at that time point along with change in value since the previous time point.
NOTE: History charts for an account start from the time that account has been added. Over time, more time points are added.
2. Audience Activities
This sub-section gives insights about how audience activities are evolved over time, and that helps in determining how growth targets are being met and if some change in strategy is needed.
This sub-section includes the following charts:
- New Followers History
- Profile Views History
- Impressions History
- Reach History
- Website Clicks History
- Direction Clicks History
- Phone Calls History
- Email Contacts History
- Text Messages History
The following time periods are available for history charts:
- All Time (Default)
- Year
- Month
- Week
- Day
- Hour
Tapping on a chart reveals the value at that time point along with change in value since the previous time point.
NOTE: History charts for an account show activities 30 days prior to when that account has been added. Over time, more time points are added.
NOTE: Charts with no data are not included.
3. Audience Gender and Age
This sub-section gives insights about audience gender and age distributions, and that helps in determining how to optimize posts and stories for current gender and age groups. It also helps in deciding if different gender and age groups need to be targeted.
This sub-section includes the following charts:
- Gender Distribution
- Age Distribution
- Gender/Age Distribution
Tapping on charts reveals the number of followers in each category along with their percentage of the overall number.
4. Audience Demographics
This section gives insights about audience demographics, and that helps in determining how to optimize posts and stories for the right demographics. It also helps in deciding if different demographics need to be targeted.
This sub-section includes the following lists:
- Audience Countries
- Audience Cities
- Audience Languages
Each item in the list shows the number of followers along with their percentage to the overall number.
5. Online Followers
This sub-section gives insights about when followers are mostly active on Instagram, and that helps in determining best time to publish a post or make a story.
This sub-section includes the following charts:
- Average Hourly Online Followers (Daily View)
- Average Hourly Online Followers (Weekly View)
The number of current online followers is show at the top.
Tapping on a chart reveals the average number of followers at a time point.
Tapping the legend of Daily View chart allows for showing/hiding data for different weekdays along each other. That helps for comparing trends in different weekdays.
Comments
0 comments
Please sign in to leave a comment.